There are two types of errors in this world…
There are two types of errors in this world…
Type I and Type II errors.
In this post we’ll be going over the two types of common statistical errors. If you are like me and have had trouble keeping these straight then this may be helpful. I’m going to assume you are familiar with hypothesis testing for the rest of this post. If you don’t know what a hypothesis test is I think my other post offers a pretty intuitive introduction.
Let’s say we have two hypotheses, we give two groups of patients different pills and measure their test scores. The first group get a pill with a drug in it; the second group gets a pill with a placebo in it. We then record the mean tests scores, the mu values below.
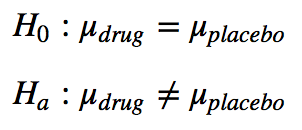
The first or null hypothesis says that giving patients a drug does nothing because the mean test scores are the same for drugged and non drugged patients. The second or alternate hypothesis is that the drug does have some affect and that the effect of the drug makes the mean test scores of drugged and placebo patients different.
Type I Errors
A type I error is an incorrect rejection of the null hypothesis. The p-value you get from your statistical test is the probability that you rejected the null hypothesis when it was true; the p-value is the probability of making a type I error. So if you get a lower p-value for yous statistical test you lower your chances of making a type I error. Usually though you want to pick a ‘signifigance level’ and stick to it. So you can say ‘my p-value was 0.02 which is signifigant at the 0.05 level.’ This tells the reader that you are willing to take a 5% chance of making a type I error and that your test outperformed this expectation by getting a lower p-value.
This image illustrates a type I error:
Example of Type I Error
Assume for the hypothesis above you got a p-value of 0.10 for your test statistic on the placebo data that would mean you would have a 10% chance of rejecting the null hypothesis when it is actually the correct one. You would have a 10% chance of making a type I error.
Type II Errors
A type II error is an incorrect recjection of the alternate hypothesis. This is usually measured by its inverse: statistical power. Statistical power is the probability of not making a type II error. It is the probability of finding a statistically significant result on any one run of your test. You want your statistical power to be as high as possible; you can get it higher by including more data (a bigger sample). You can see examples of weak statistical power by re-running a hypothesis test with a 0.05 p-value threshold. Some statistical tests will always come in below 0.05 and some will sometimes end up above 0.05, lowering the statistical power of those tests.
Example of a Type II Error
I had typed up a solution to show you how to calculate the statistical power but it was confusing. It requires enough explanation to warrant it’s own post in the future. In short we want to ‘reverse’ our hypothesis test; we create a new distribution with mu_drug as the mean and we ask “what is the probability of rejecting the original null hypothesis?” using this new distribution and original signifigance level.
This image shows this process quite well:
If you are confused by some of this check out this post. It does a pretty good job of explaining statistical power. Or this page.
I hope this short post was helpful in understanding types of statistical errors.